


Three Common Mistakes People Make When Interpreting Data


Data science is a powerful tool – if you know how to use it correctly. Problem is, a lot of people don’t. Here are three of the most common mistakes – and how to fix them.
As a data scientist, I am, as you can imagine, highly in favour of making business decisions based on data. The problem is that data can often be misinterpreted, leading to poorly informed decisions that might be detrimental to the business. More often than not, this is not deliberate or malicious, it just comes down to human error. Here, I’ve rounded up three of the more common mistakes and how to address them.
1. Thinking unrelated variables have a causal effect
The link between related variables in data often has a statistical link, however the presentation of these various elements may be misleading. I'm not saying your local and loved data analyst has been pulling the wool over your eyes.
What I am saying is that when you read the data presented, the interpretation of variables may not be causal. Lemme give you an example:
The relationship between page views and on-site purchases in the ecomm environment are in fact not causal. That may seem counterintuitive, because logic would dictate that you need to be on the page in order to purchase, right? While that may be factually correct, however, data thinking would argue that a mere page view, without intent, can never result in a purchase conversion.
Data thinking would require there to be an intentional action or actions in the following progression: viewing the page, exploration of an item in a specific manner, adding to cart and then checking out.
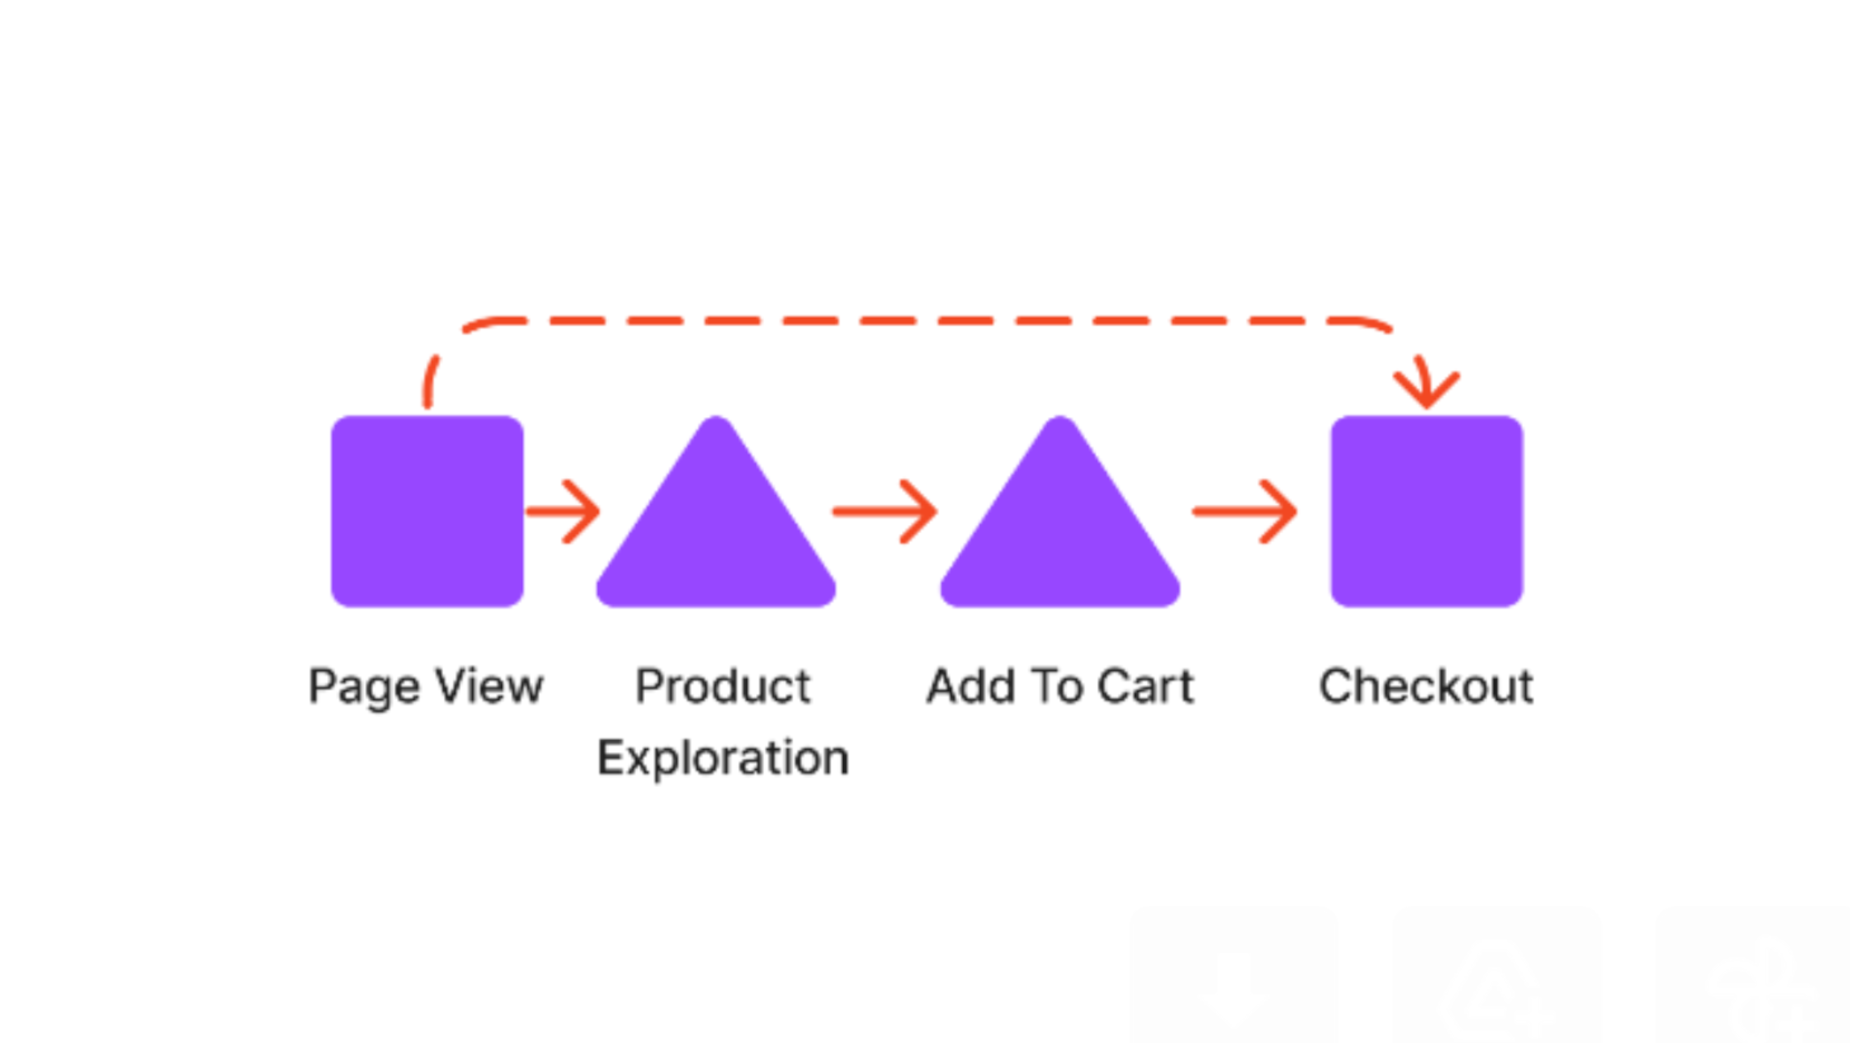
We can see how the data story of a purchase is illustrated here, denoted by the arrow progression. And also the anecdotal link between the data should it be displayed as the variables of ‘Page View’ and ‘Checkout’ only – denoted by the dotted line.
The data story your aforementioned trusted and loved data analyst understands is that the intention shown by the progression through the user journey from page view to checkout has milestones, or goals, along the way.
The coincidental grouping of variables that have no correlation may oftentimes lead to a misinterpretation of data gathered and as a result a misleading course of action is embarked on, not succeeding in the marketing journey needed.
2. Confusing the nature of the data: Descriptive vs Prescriptive
In isolation these words are self-explanatory, and one of the times speaking data and speaking English shake hands. Unlike, for example, 'mean' – very different definition in data analytics than it does in common language….
However, the presentation of these data sets may be very misleading. One describes the events that have passed, while the other prescribes action to be based on previous findings – both deduced from a single data set, at first. If we follow the example illustrated previously, the descriptive data analysis would be that people have visited a page, they have explored a product, added it to cart and then checked it out.
Descriptive and Prescriptive data are on the opposite spectrum of data analytics, one is used to verify the actions taken previously:
Descriptive: We spent R100 000 on a marketing campaign over three weeks; did we bring in the sales to justify the ROI? Let’s log the purchase journey from acquisition to check-out and see how many have come from the campaign.
While the other is used to inform decisions to be taken in future:
Prescriptive: We understand that we do not normally sell out of this item online, however as a result of the marketing push behind it, we may run out of the item; let's use a regression modelling tool to see when we may be running low on it based on current rate of sale, and make sure we share the data with logistics to ensure it’s available all over the country.
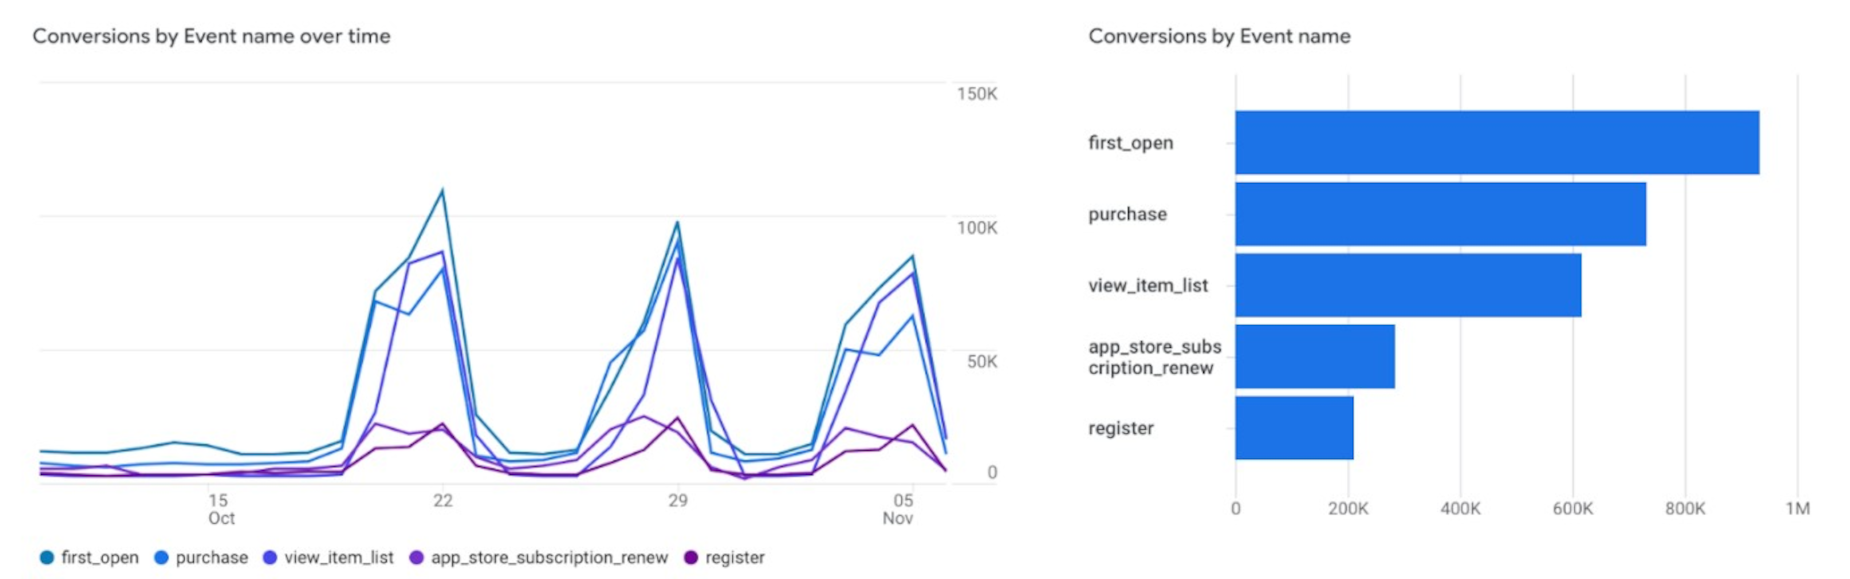
In the illustrated example, we see clear spikes of conversion activity across various events classed as goals. And this is a purely descriptive view of these actions. Interpretations of these patterns and how to understand them will be covered next. In the meantime, it’s important to note how no prescriptions of actions are illustrated, no future actions – rather this a pure historical documentation of events.
A common mistake is to attribute past actions to future occurrences – at least in data analytics.
3. Reading into results without context
Finally, once you have noted the causality between dependent variables, understood that they are descriptive and created a view of them, how do you know you’re still not making the last mistake? I.e. that you’re contextualising the results correctly?
Let’s create a hypothetical scenario: you’re a Telco who sells Fibre To The Home. And in January 2022 you start seeing an increase in purchases in residential areas. Instead of 100 Mbps lines the residential areas start ordering 500Mbps lines with regularity.
The initial thought here would be, “Wow, our home internet products must be incredible! People love them!” and that may be so, but the question that keeps data analysts coming back day after day is, why? Why are these package purchase patterns different?
Your analytics view would show you that marketing efforts have not changed and price has not become more competitive – so what could the driver be?
One of your analysts explains:
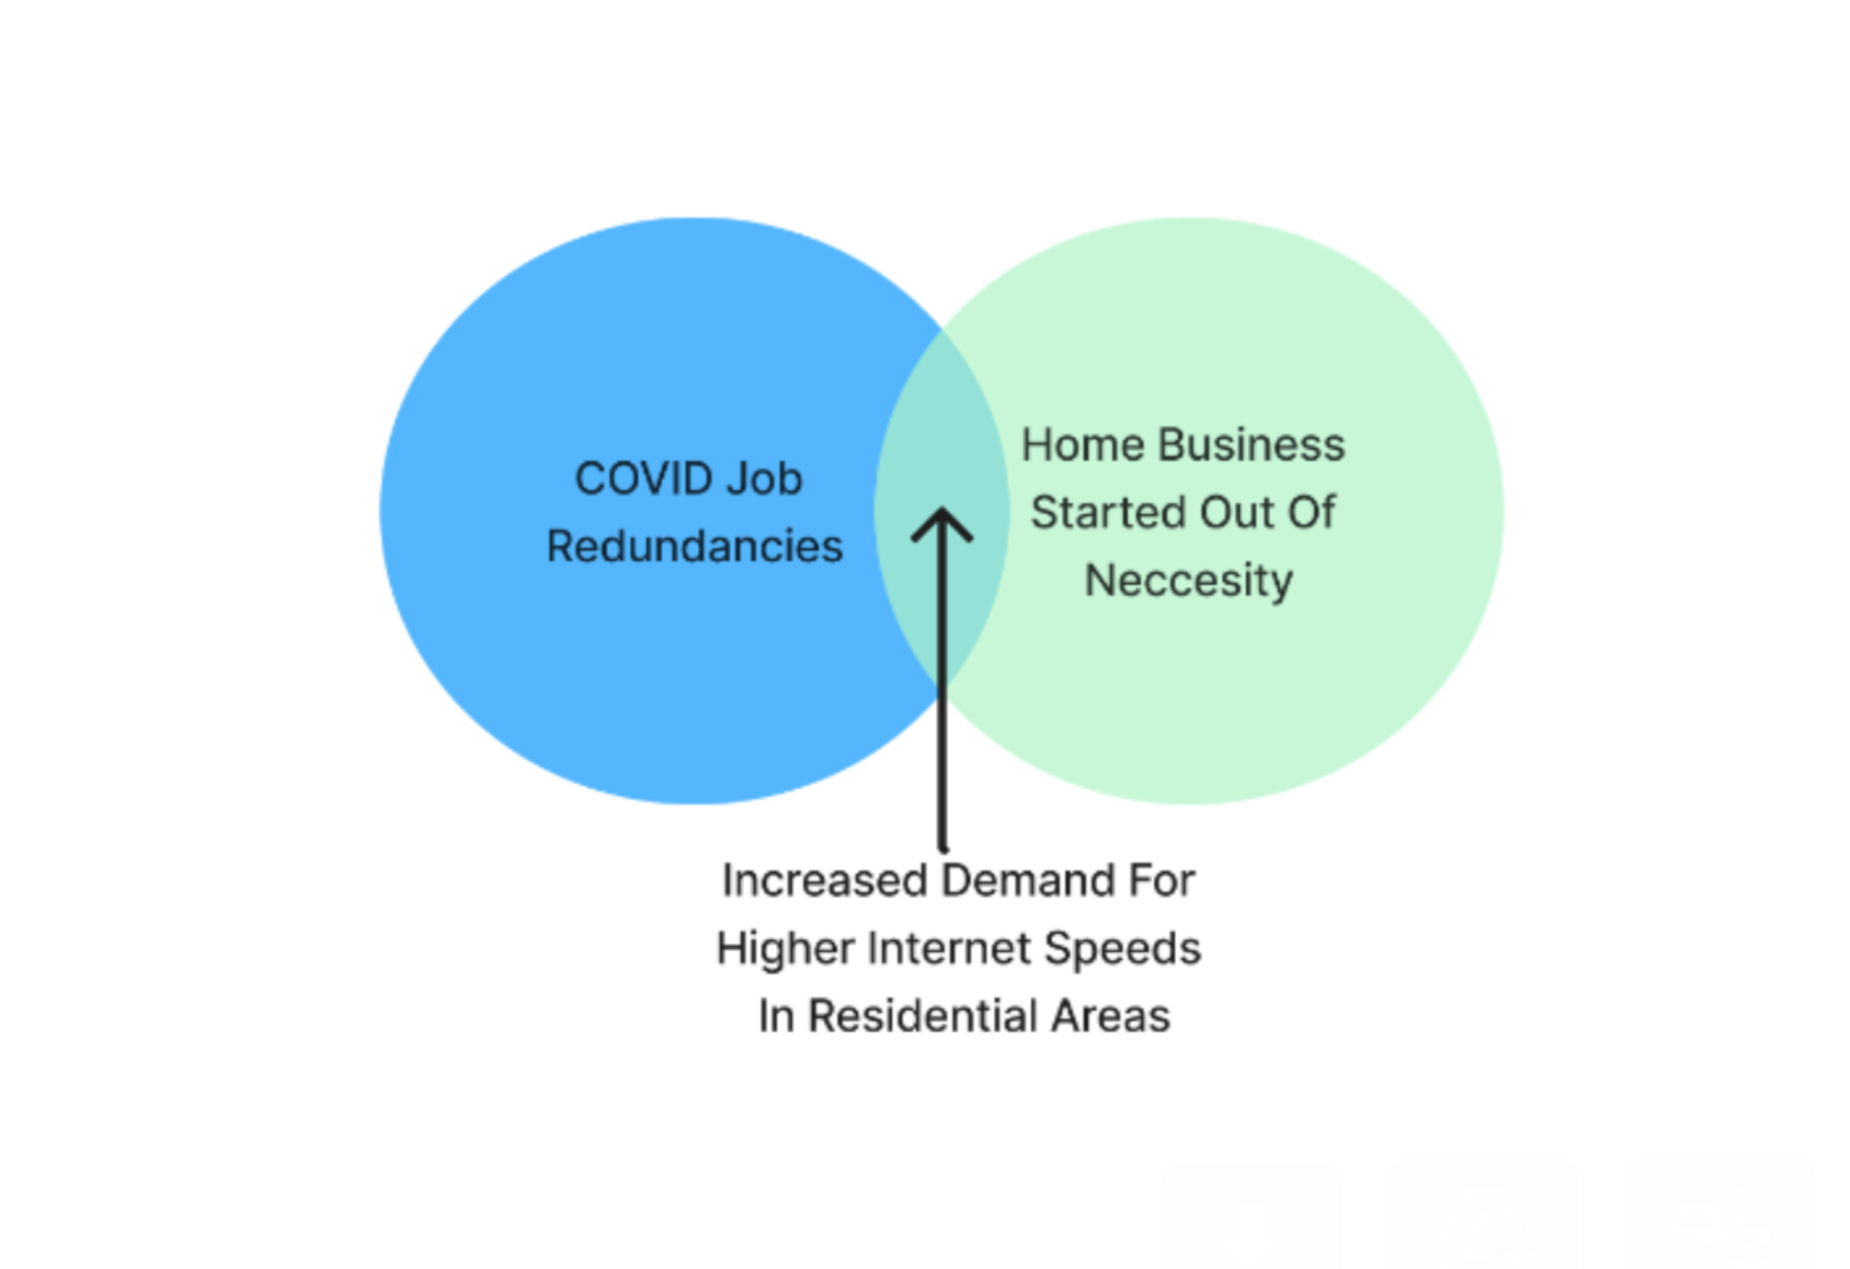
“As a result of the covid restrictions and many people being made redundant, there was an uptick in businesses started from home. Which may have meant that the standard connection preferred for streaming and social media use at home wasn't enough – the businesses started in these residential areas require a higher line speed and as result we are seeing the trend described here.”
The description of the sales data around home internet may have increased in this example – but the interpretation of why is more important.
And this is the importance of contextualised data analysis. The understanding of the macro-economic factors around the dependent variables, described by the data is as important as any of the previously mentioned factors.
In this example the takeaway may be to create auxiliary products around the package uptake described in the datasets to cater for the emerging market. When interpreting data, a common mistake is to view it in isolation, forgetting that data is the result of many factors extrinsic to the platform it is being gathered from.