


How Our Media Lifestyles Shed Light on Our Habits

With the broad popularity of smartphones has come an unprecedented spread of social networking services (SNSs), use of online video and music streaming services, diversification of media, and varied viewing habits. That makes it difficult to gain a comprehensive view of how people use media.
In Japan, certainly data is available concerning media usage rates and times, but we thought it open to question whether such data would enable us to map out people’s individual media habits.
Thus, rather than drawing from such data, Dentsu’s Media Innovation Lab decided to examine the sequence of media users’ daily activities: when they wake up, go out, return home, use media, and go to bed. These were recorded in the MCR/ex behavior and media usage database.
Initiated in 1997 by Video Research Ltd., the database contains entries made by study participants who recorded their daily activities and media usage in 15-minute intervals for 24 hours over a seven-day period. The database provides a window on current media-related lifestyles of the Japanese participants.
The data we analyzed covered 4,971 research participants between the ages 12 and 69 living within 50 kilometers of Tokyo Station, in Tokyo and the surrounding Kanto region in 2017.
Social sequence analysis was used to look at the media our research participants used over a period of one week, as well as when—morning, afternoon, and/or evening—each day they did so.
Ultimately, we identified seven categories and 30 types of media users. The methods we used and the categories identified are described below by Akira Miwa, research director at the Media Business Innovation Department of Dentsu Media Innovation Lab.
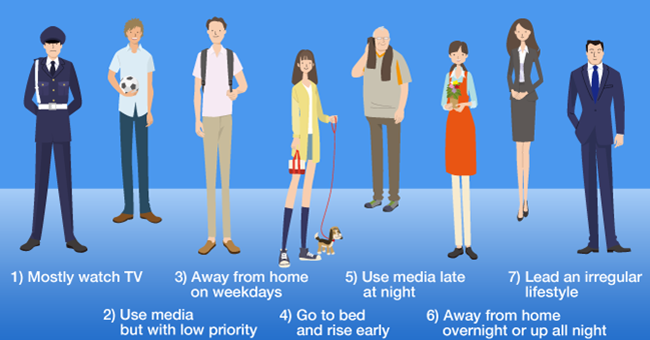
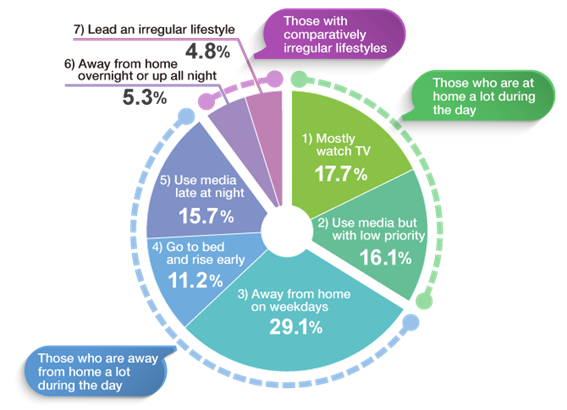
Seven categories and 30 types of media lifestyles identified
Chart 1. Media-related Lifestyles
The data we analyzed covered research participants between the ages of 12 and 69 living within 50 kilometers of Tokyo Station, in Tokyo and the surrounding Kanto region.
Based on our analysis of the data, we divided the participants into the seven categories shown in the above pie chart.
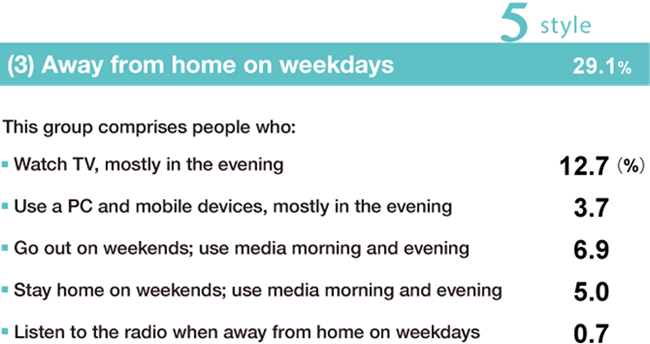
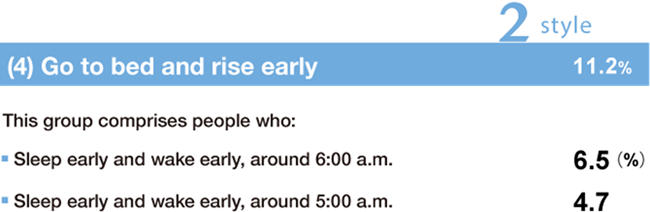
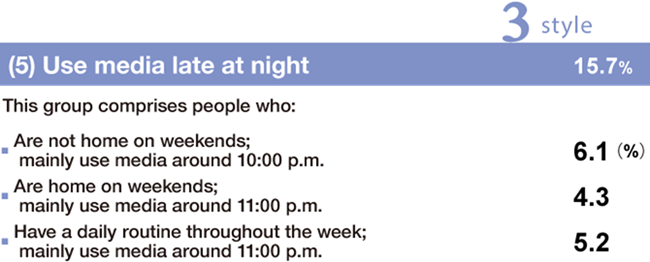
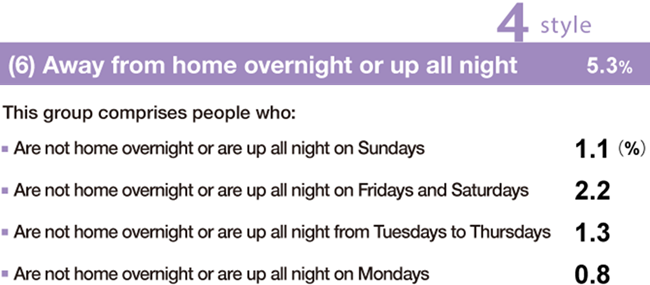
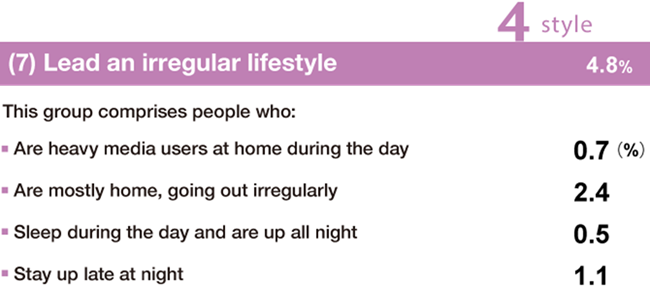
Then, based on the fact that the differences in people’s daily routines affect their use of media, we found that media users may be divided into three main groups: Those who are at home a lot during the day (see pie chart, 1 and 2); those who are away from home a lot during the day (3, 4, and 5); and those with comparatively irregular lifestyles (6 and 7).
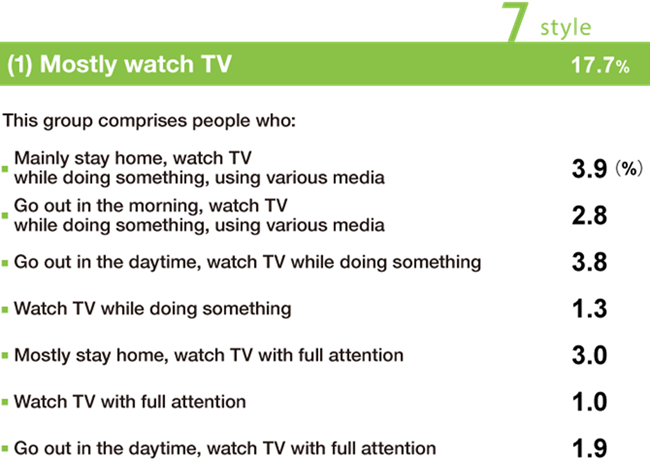
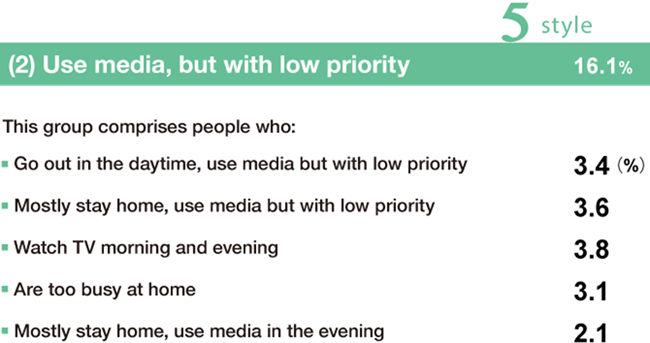
Further, by breaking down the seven categories into 30 sub-categories, we could show the usage patterns for new and established forms of media at various times in a day over a week.
From that we extrapolated a broad range of media-related lifestyles and the ratio of those in each group.
Finding the data to identify media lifestyles
Data can be acquired in real time from the logs of research participants who use media—not only television but also computers and digital devices, such as smartphones and tablet computers. By compiling and analyzing such data, we can get a clear picture of their media usage.
Meanwhile, we need to think of ways to better understand older generations of people who closely follow current events by reading newspapers as well as using smartphone news apps.
In other words, to understand media lifestyles, we also must include the conventional forms of media. Radio, for example, including apps such as Radiko, will continue to be a vital form of media for young generations of smartphone users in our car-dependent society.
It is for this reason that we tried to understand media lifestyles by teaming up with Video Research and using its MCR/ex research database with data for about 50 daily activities and media usage, inside and outside the home.
Research participants selected which of the database items described what they did every 15 minutes of the day over a week.
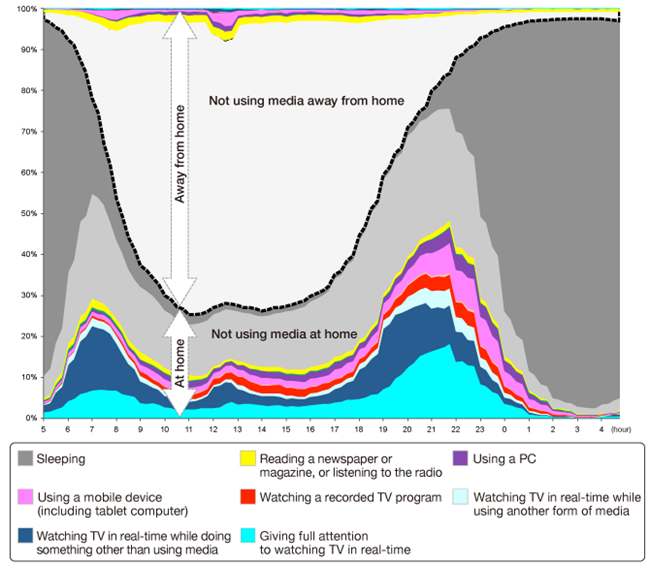
For all participants in the MCR/ex research, the chart below shows their behavior: whether they were at home at specific times between 5:00 a.m. to the early morning hours of the next day, starting from the first day of data collection (Monday).
The Y axis indicates the ratio of participants involved in specific activities. One can see, for example, that the ratio of people watching TV at home rises from the time they wake up, while the use of mobile devices outside the home jumps at around noon. And in the evenings, activities such as watching TV and using mobile devices and PCs at home pick up starting around 7:00 p.m. and peak at around 10:00 p.m.
Chart 2. Participants’ Behavior over 24 Hours on a Monday
(all participants aged 12 to 69 over 24 hours from 5:00 a.m. on Monday)
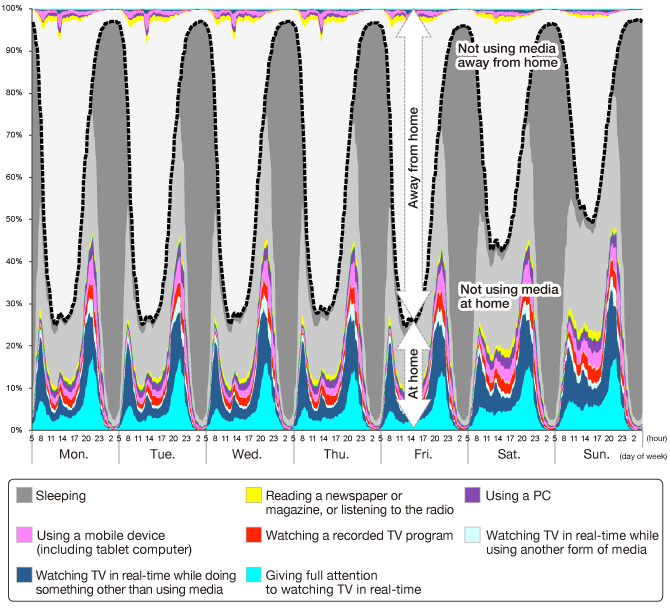
From the chart below, it can be seen that the data for all participants over a week (Monday through Sunday) indicates that the patterns of media use are repeated daily.
Meanwhile, on Saturdays and Sundays, we can see that, during the day, the percentage of people at home is comparatively higher, and media tend to be used there throughout the day.
Chart 3. Participants’ Activities over One Week
(all participants aged 12 to 69 over one week from Monday to Sunday)
The cumulative data enabled us to identify the media lifestyles of the research participants and, based on their behavior, to determine how many had the same lifestyles.
A statistical method uncovering media lifestyles
With the participants recording their daily activities and media use every 15 minutes around the clock over seven days, we had 672 time points per person. We thus needed both a way of calculating the degree of similarity among the 4,971 participants, and a way of dividing them statistically into categories.


